We collected around 100 survey results over social media and 270 from going around to various lunches and collecting survey results from everyone. Almost all people were compliant.
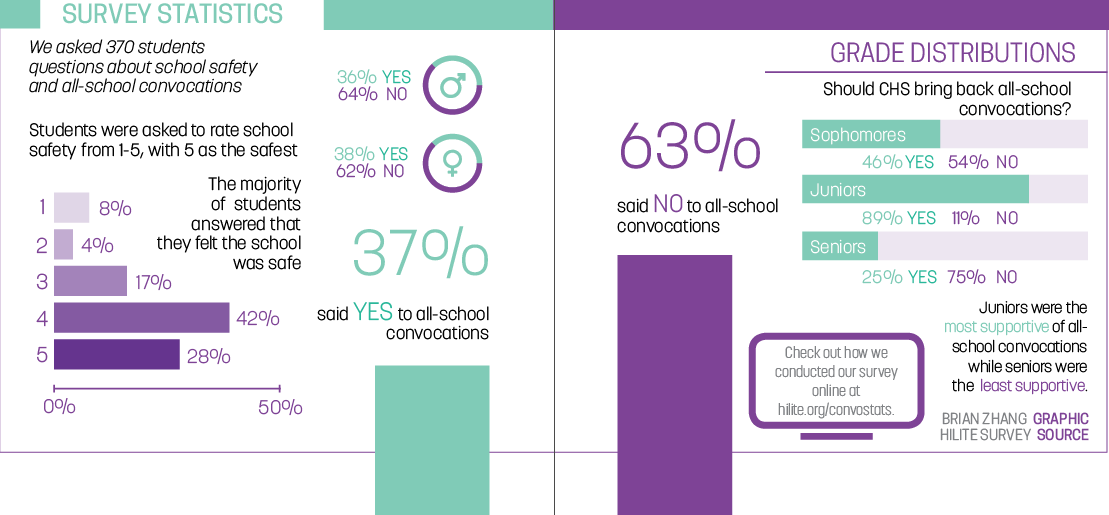
Of the sophomores we sampled 51 said yes, 59 said no. Of the juniors, 54 said yes, 7 said no. Of the seniors, 24 said yes, 72 said no. Of the freshman we sampled, 9 said yes, 6 said no. We decided to not interview many freshman because they did not have the experience of an all-school convocation.
Of the females we sampled, 78 said yes, 125 said no. Of the males, 61 said yes, 106 said no.
We interviewed a total of 370 students.
We understand that there may be statistical error and misrepresentation of data.
Survey conducted by: Brian Zhang, Kelly Truax, Isabella White, and Sarah Kim
Related Posts:
- Fandom and friendship: building communities through K-pop For junior Aadya Subramanian, Korean popular music, abbreviated as K-pop, is something that she’s been interested in for a long time. “My friend’s interest sparked my curiosity in K-pop and I also wanted to relate with them, so I started…
- Japanese exchange program bridges cultural differences, fosters unique friendships Senior Ismail Kheiri’s decision to host an exchange student in this school’s Japanese exchange program was sparked by his own previous experience as an exchange student, along with a personal curiosity “I’ve always been interested in foreign language and I’ve…
- Students, teacher discuss perception of space exploration For junior Amelia Arterburn, space exploration holds a certain intrigue. She took the astronomy class this school offers because of her interest in the night sky and the space beyond. “When I was younger, I loved looking at the stars,”…


![Cal Carmichael starting for Carmel last season. Carmichael said he wants to do everything he can to help the team win every time he steps on the mound. [Submitted: Cal Carmichael]](https://hilite.org/wp-content/uploads/2026/04/Screenshot-2026-04-13-3.40.48-PM.png)


![Review: Project Hail Mary is a visually stunning film filled with deep emotion, humor and a heartfelt partnership [MUSE]](https://hilite.org/wp-content/uploads/2026/05/PHM2-2.jpg)
![Review: “Iron Lung” exemplifies the success of suspense [MUSE]](https://hilite.org/wp-content/uploads/2026/04/IronLung-1200x675.webp)
![Review: New F1 regulations prove to be anything but boring [MUSE]](https://hilite.org/wp-content/uploads/2026/04/2-1-1200x675.avif)
![“‘Wuthering Heights’” wasn’t a bad movie—it just wasn’t anything like the book [MUSE]](https://hilite.org/wp-content/uploads/2026/02/wutheringh-960x1200.webp)
![Review: Season 5 of “Stranger Things" delivered the perfect ending despite major mistakes [MUSE]](https://hilite.org/wp-content/uploads/2026/01/ems-810x1200.jpg)
![Review: “Zootopia 2” is a stunning and engaging sequel that elevates the universe [MUSE]](https://hilite.org/wp-content/uploads/2025/12/bjUWGw0Ao0qVWxagN3VCwBJHVo6-800x1200.jpg)
![Review: I have no critiques: “Demon Slayer: Infinity Castle” is amazing [MUSE]](https://hilite.org/wp-content/uploads/2025/12/MV5BOGQ3YWUzYjEtMTJiYy00ZjQ0LWI0YjktYjhiNGVhNGExYTM3XkEyXkFqcGc@._V1_FMjpg_UX1000_-797x1200.jpg)
![Review: Learning to say “I” with “The Fountainhead” [MUSE]](https://hilite.org/wp-content/uploads/2025/12/The_Fountain_Head_1943_1st_ed_-_Ayn_Rand.jpg)
![Review: Java House Fall Menu [MUSE]](https://hilite.org/wp-content/uploads/2025/12/Screenshot-2025-12-01-at-15.10.19-1200x618.png)
![Review: "When I Fly Towards You", cute, uplifting youth drama [MUSE]](https://hilite.org/wp-content/uploads/2023/09/When-I-Fly-Towards-You-Chinese-drama.png)
![Postcards from Muse: Hawaii Travel Diary [MUSE]](https://hilite.org/wp-content/uploads/2023/09/My-project-1-1200x1200.jpg)


Stat Department Chairperson • Sep 21, 2018 at 11:30 am
Brian,
I appreciate that you were honest about potential biases that my be present in your sampling method. Gathering valid data is not an easy task; which, hopefully, is something you realized with this observational study. If the data you collected was representative of the school’s student body, then I think your graphics did a good job of helping readers understand the relationship that exists between the variables safety, convocation, gender and grade level. One thing I would suggest is that when providing further details about the data collection process it is good practice to include the survey questions. This allows readers to identify if there are any issues with how the questions are worded. Transparency in how you gather data will improve trust.
Sincerely,
Mr. Wernke